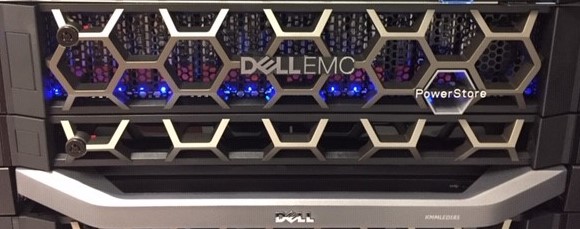
As I mentioned here, we were beta testers for the Dell PowerStore all-flash storage array. We tested everything from initial imaging of the array as either a Model T or Model X all the way to importing external storage arrays. We really enjoyed having the opportunity to get our hands on the gear early and appreciated getting ahead of the release so we were ready to answer customer questions on day 1. Eventually, they made us give that beta array back to them (the nerve!) and we were all sad to see it go. The empty rack space was taunting us.
Our lab environment includes lots of Dell gear, including Unity, SC, FX2 servers, MX7000 blades, VRTX, N & S series switching, VxRail, IDPA, Isilon, and more. We don’t actually run any of our internal systems on this gear. We use this to support customer needs such as demo, proof of concept, swing gear, feature/scenario testing, and things like that. We do this through a mix of bringing our equipment on-site to customers as well as supporting remotely right from where the gear is installed in our lab. Obviously, it was killing us to no longer have the latest and greatest!
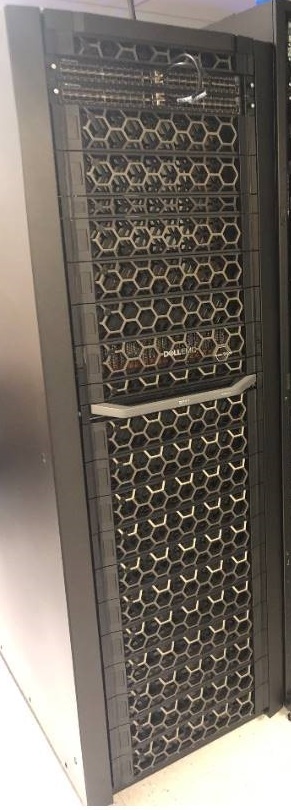
- 768GB Memory
- 48 CPU Cores @ 2.1Ghz
- Loaded up with 57TB of NVMe SSD in the base enclosure
- Dual NVRAM cache drives totaling about 16GB
- 8 x 10Gb ethernet ports
- 8 x 32Gb Fibre Channel Ports
Installation into the WTG Integration Center by the Professional Services team went smoothly, and they’ve already begun doing some testing and integration on the array to support more advanced demo and POC type scenarios.
“Straight forward to setup, easy to use MGMT UI”
–Raj Patel, Lead HCI Engineer
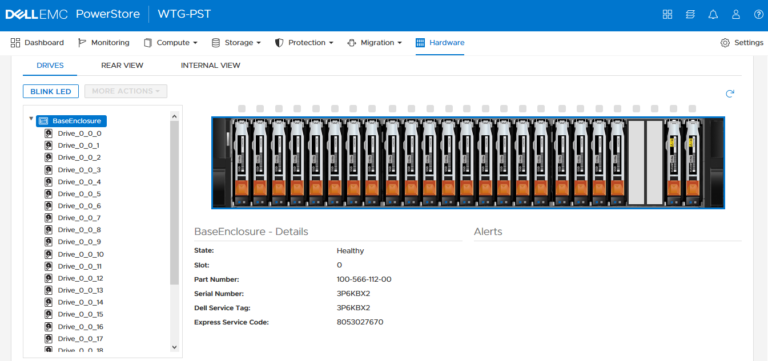
Logging into our new system, we can see the hardware view in the GUI for this config looks like this:
Looking at the virtual drive tray above, which represents the front of the base enclosure, you can see drives 0 – 20 are the 3.5TiB NVMe SSDs. Then there are 2 empty slots at position numbers 21 & 22. Next to those you can see the 8GB NVMe NVRAM drives that the appliance uses for caching functions.
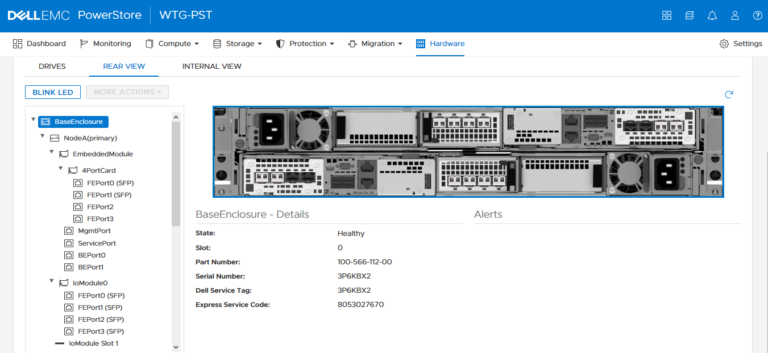
Below you can see the backside of this base enclosure:
Looking at this view, you can see the IO modules, power supplies, and even empty bays where we can put more IO modules if needed. If you click on any of the components in the image, it shows you a summary and health status for those modules.
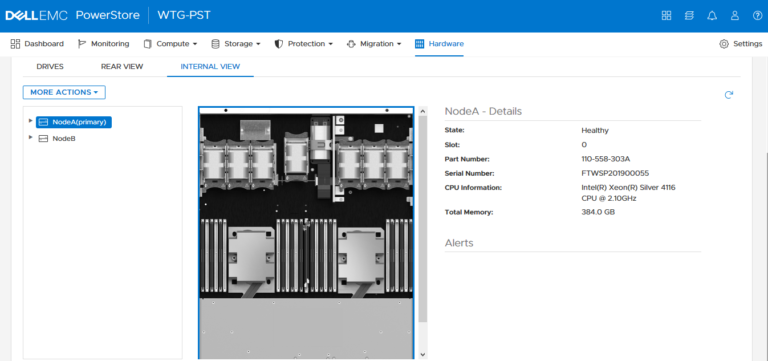
This next perspective is pretty neat. Its a view of the inside of the controller, as though you were looking down at the motherboard:
Again you can click on any components and it will give you a summary and health status. You can click on individual memory DIMMs, fan modules, or even the internal battery.
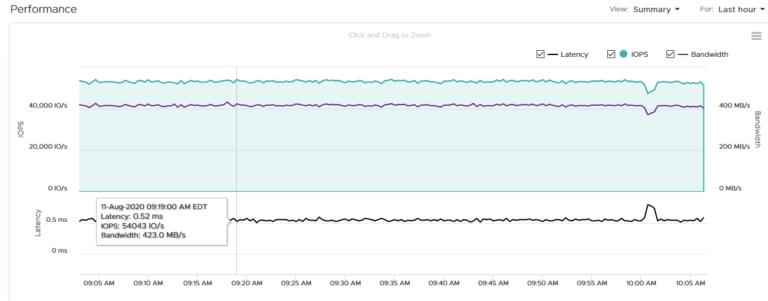
Taking a step back from hardware, I noticed that the WTG Professional Services team is working on some deployments and other activities on this device as I was taking these screenshots. Check out the high-level performance screen!
The PS team was getting some work done this morning because the array is humming along doing about 54,000 IOPS consuming 423MB/s of bandwidth. That means we are looking at a pretty small block size of about 8KB. Wonder what they are up to? I also note that the latency is down around HALF of a millisecond. Not too shabby!
We are excited to support some fun tests, POCs, and demos as we put this beauty to work! Have any questions or comments? Let me know below.

